DECADES DYNO5ABACUS STD SPEED
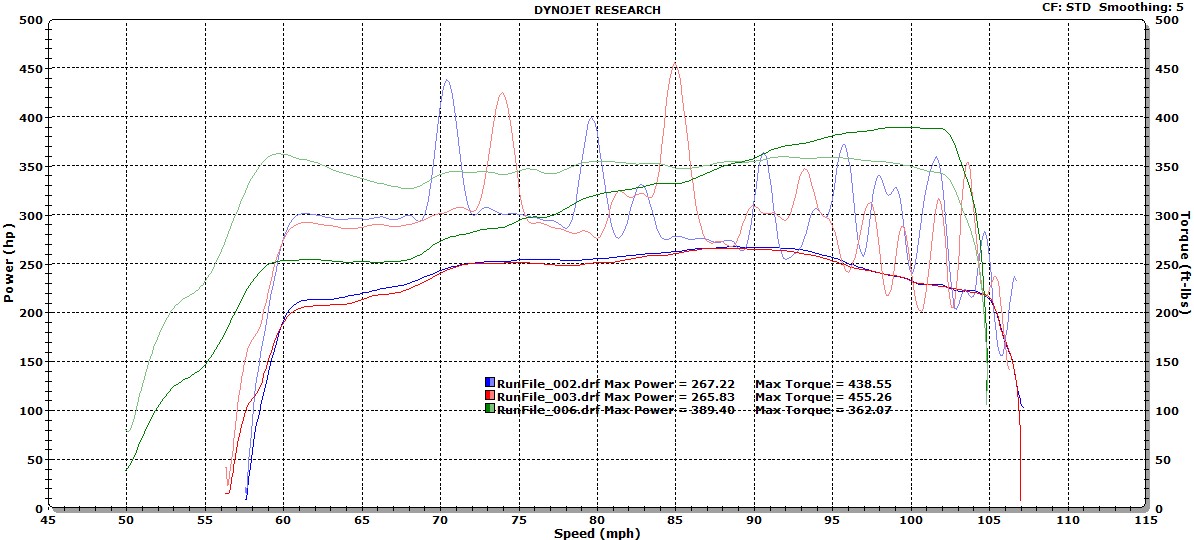
These are my 2 "before" runs at Abacus and my best "after" run at Abacus with STD correction and smoothing at 5 so to give an accurate comparison to Stillen's graphs. With the X axis set to speed, the "before" graphs show the full range, but give crazy torque values- again you have to mentally connect the valleys of the graph and ignore the peak values. My before peak HP was less than Stillens, but the overall shape was the same.


Recommended Comments
There are no comments to display.
Join the conversation
You can post now and register later. If you have an account, sign in now to post with your account.
Note: Your post will require moderator approval before it will be visible.